

The Real Reason Two Dashboards Never Agree
Every analytics team eventually has this meeting. Someone pulls up a slide with a number on it. Someone else says that's not what their dashboard shows. Both dashboards get opened side by side. Both are technically correct, and the meeting spends the next twenty minutes on definitions instead of decisions.
In why more data hasn't made your business smarter, we looked at why adding more dashboards and data sources doesn't fix decision-making by itself. This is the specific, visible symptom of that problem: two reports, built from data that ultimately traces back to the same business, showing numbers that don't match. It happens constantly, and it isn't a data quality problem in the way most teams assume.
Key Takeaways
- When two dashboards disagree, both numbers are often correct by their own definition. The problem is that the definitions were never reconciled in the first place.
- Fixing individual reports one at a time doesn't solve this. It just moves the disagreement to the next pair of dashboards someone happens to compare.
- The actual fix is a single governed layer where business terms are defined once and every report pulls from that same definition, instead of each report defining its own version.
- That governed layer has a name (a semantic model), and building one is foundational work that has to happen before reporting, and long before AI, can be trusted.
A Concrete Example: Three Versions of "Active Customer"
Here's a version of this that shows up constantly, across industries and company sizes. Picture three teams, each building their own dashboard, each using the term "Active Customer."
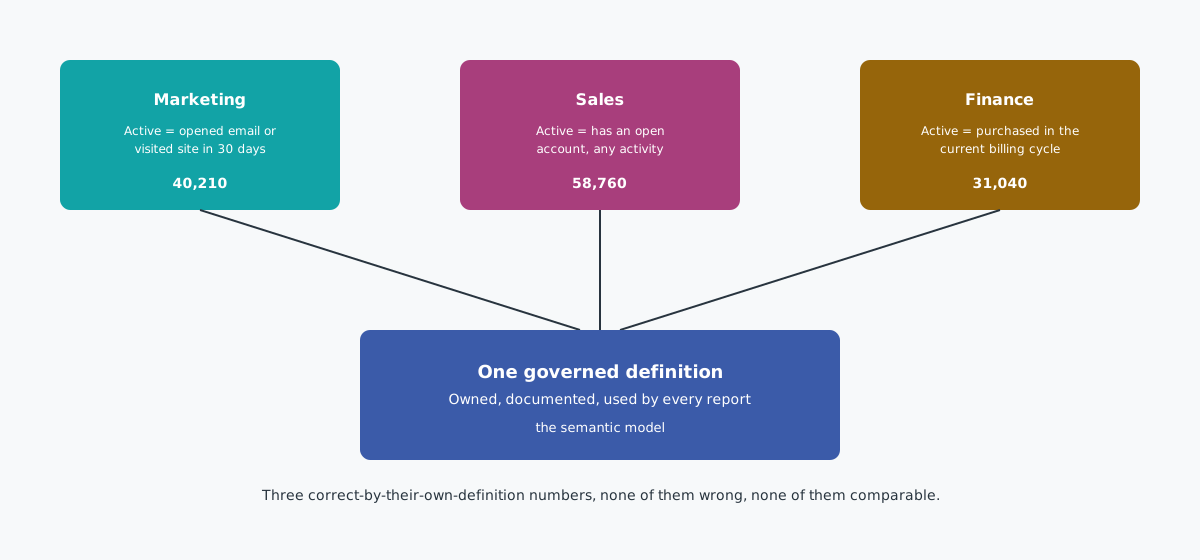
Marketing defines it as anyone who opened an email or visited the site in the last 30 days. Sales defines it as anyone with an open account, regardless of recent activity. Finance defines it as anyone who made a purchase in the current billing cycle. Each definition made sense to the team that built it, solving a real problem for that team's specific use case.
None of these teams did anything wrong. Each one built a metric that answered their own question correctly. The problem only appears once someone tries to compare the three numbers, assumes they should match because they share a label, and finds out they were never meant to.
Why Patching Each Report Doesn't Work
The instinctive fix is to find the report with the "wrong" number and correct it. That doesn't work, for two reasons.
First, there usually isn't a wrong number. Marketing's definition of Active Customer is genuinely useful for planning a campaign. Finance's definition is genuinely useful for revenue forecasting. Neither team should abandon a definition that correctly serves its own purpose just because it doesn't match another team's number.
Second, even if you did correct one report, the next report built next month starts the whole cycle over. Whoever builds it will make their own reasonable choice about what "Active Customer" means, because nothing in the organization tells them a decision has already been made. Patching individual reports treats the symptom. The underlying condition, that there's no shared, owned definition anywhere, stays exactly the same.
How This Compounds as a Company Grows
The problem rarely stays at three teams and one metric. Every new hire who builds a report makes their own reasonable call about what a shared term means, because nothing tells them a decision was already made somewhere else. Every new tool the company adopts, a new marketing platform, a new finance system, a new product analytics tool, arrives with its own default definitions baked in, and those defaults quietly become one more version of "the truth."
A year in, it's not three definitions of Active Customer. It's five or six, scattered across tools nobody fully audits, each one still technically correct, each one now harder to trace back to a decision anyone remembers making. Nobody chose this outcome. It's just what happens by default when definitions live inside individual reports instead of in one place everyone can see.
The Real Fix: One Governed Definition Layer
The fix isn't picking a winner among the three definitions. It's building a layer, sitting above the raw data and below every report, where "Active Customer" (and every other shared business term) is defined once, documented, owned by someone specific, and used by every dashboard that needs it.
That doesn't mean marketing, sales, and finance can never look at customer activity differently. It means that when they do, the difference is a deliberate, documented choice (a "Marketing Active Customers" metric and a "Billing Active Customers" metric, both clearly named and clearly scoped), rather than an accident of three people never talking to each other.
In practice, "governed" means three specific things exist for each shared metric: a written definition anyone can find without asking around, a named owner responsible for approving changes to that definition, and a single calculation that every report references instead of recreating. None of that requires new tooling by itself. It requires deciding, deliberately, that this work happens before the next report gets built, not after the next disagreement surfaces.
This layer has a specific name in modern BI architecture: a semantic model. It's the governed translation layer between raw tables and business meaning, and it's the direct fix for the exact problem in this article. We'll walk through what a semantic model actually contains and how it works in the next piece in this series.
Where This Fits
At ClarusIQ, this is Data Foundation work, and it usually starts before any new reporting or AI initiative gets scoped. Auditing which metrics exist, how many conflicting definitions each one already has, and who should own each definition going forward is unglamorous, deliberate work. It's also the specific thing that stops next quarter's dashboard from restarting this same argument.
If your organization is regularly having the "whose number is right" meeting, that's a clear, specific signal, not a vague sense that your data "could be better." It means the definitions were never reconciled, and reconciling them is a scoped project with a real starting point: list the metrics that show up in more than one report, find every place each one is currently calculated, and compare the logic side by side. Most teams are surprised by how few metrics actually need this treatment. It's usually a short list of high-visibility numbers, not the entire data warehouse, which is part of why this work is more tractable than it sounds from the outside.
If you want a second set of eyes on how many conflicting definitions are already live in your reporting, talk to us about auditing your metric definitions.
Next in this series: what a semantic model actually is, in plain terms, and what specifically belongs inside one.