

One Model for Google, Meta, LinkedIn, TikTok, and Your CRM
Spoke 2 covered what breaks first as an agency outgrows spreadsheets. This piece picks up where that leaves off: once the reporting logic moves out of individual files, what does it actually mean to combine five different ad platforms and a CRM into one model instead of five separate exports.
The short version: "true ROAS" and "true cost per lead" don't exist as numbers any single platform can give you. They're calculated values that only become possible once spend, leads, and conversions from every source are reconciled into one consistent structure. Until that structure exists, "blended ROAS" is usually someone manually adding numbers from five tabs into a sixth one, recalculated by hand every month.
Key Takeaways
- True ROAS and true cost per lead are calculated metrics that don't exist inside any single platform. They only become real once spend and conversion data from every source is reconciled into one structure.
- Power BI's approach to this is a star schema: one fact table per data source (Google Ads spend, Meta spend, CRM leads), connected through shared conformed dimensions like client, campaign, and date, per Microsoft's own modeling guidance.
- Composite models let Power BI combine these sources even when they use different storage modes, so the blending doesn't require exporting everything into one giant spreadsheet first.
- The most common blending mistakes aren't exotic: double-counted conversions, mismatched date grains, and currency or unit inconsistencies quietly break a blended number more often than a missing data source does.
Why "True ROAS" Doesn't Exist Yet
Each platform reports what it knows, in its own terms. Google Ads reports Google Ads spend and Google Ads conversions. Meta reports Meta spend and Meta-attributed results. Neither platform has any visibility into what the CRM eventually counts as a closed deal, and the CRM has no visibility into which platform actually drove which lead.
"Blended ROAS" is the answer to a question none of the individual platforms are equipped to answer on their own: total return, across every channel, measured against what the business actually cares about, revenue or qualified pipeline, not just in-platform conversion events. That number has to be built, deliberately, from pieces that were never designed to combine automatically.
The instinct, understandably, is to open each platform's dashboard, write down the spend figure, and add them up in a sixth tab. That produces a number, and the number looks plausible, but it inherits every mismatch buried in each individual source (the counting differences covered in why your client's numbers never match your platform's) without any of them being visible in the final sum. A blended total built this way isn't wrong in an obvious way. It's wrong in a way that only surfaces months later, when someone tries to reconcile it against actual revenue and the gap doesn't make sense.
The Mechanism: Star Schema and Conformed Dimensions
Microsoft's own modeling guidance recommends a star schema: separate fact tables for each measurable event (Google Ads spend, Meta spend, LinkedIn spend, TikTok spend, CRM leads), each connected to shared dimension tables, most importantly client, campaign, and date, that don't belong to any one platform (Microsoft Learn).
When the same dimension, like a client or a date, is used to connect more than one fact table, it's called a conformed dimension. That's the actual mechanism behind blending: Google Ads spend and CRM leads don't get merged into one giant table. They stay as separate fact tables, but both connect to the same client dimension and the same date dimension, which lets a report calculate "spend from Google Ads plus spend from Meta, divided by leads from the CRM, for this client, this month" correctly, without ever forcing the platforms' raw data to live in the same table.
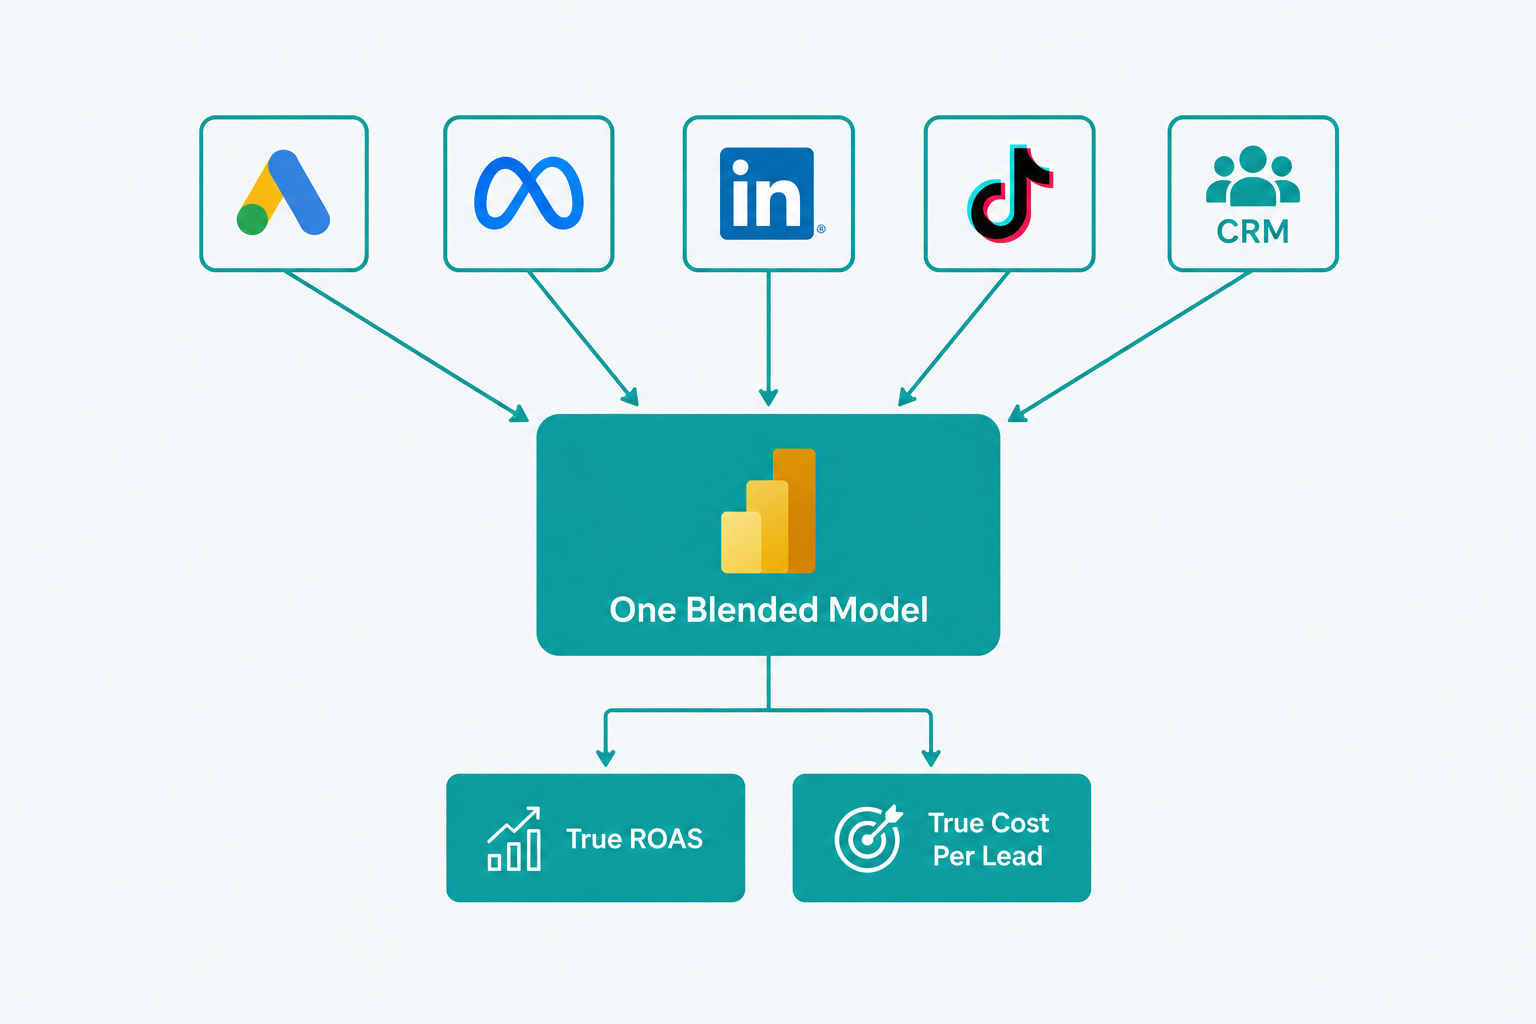
Composite models make this practical even when the five sources don't all behave the same way technically, some might be imported, some queried live, some a mix. A composite model can combine multiple source types into one model rather than forcing every platform into a single rigid connection method (Microsoft Learn).
This matters practically because the five sources genuinely don't arrive the same way. A CRM export might update once a day. An ad platform's API can return near-live spend data. Forcing all five into identical import schedules either slows the fast sources down to the slowest one's pace, or requires rebuilding the whole model every time one source's refresh timing changes. A composite model lets each fact table keep the connection type that actually fits its source, while the conformed dimensions still tie them together consistently.
What "Blended" Actually Means in Practice
A blended spend measure sums spend across every ad platform's fact table for a given client and date range. A blended lead measure pulls from the CRM's fact table, filtered to leads attributable to paid channels. Blended ROAS divides one by the other, or more precisely, divides blended revenue (when the CRM tracks it that far) by blended spend. None of these are raw numbers from any platform. Each is a certified calculation built once in the model, documented, and reused by every report that needs it (Microsoft Learn), the same certification discipline applied here across five sources instead of two.
The client and date dimensions are what make "for this client, this month" mean the same thing regardless of which platform's fact table is being summed. Without that shared structure, "total spend" from five separate exports is really five separately-scoped numbers that happen to get added together, which is exactly how a currency mismatch or a date-range mismatch slips in unnoticed.
Common Blending Mistakes
Double-counted conversions. If a lead clicks a Google ad and later converts through a Meta retargeting ad, both platforms can legitimately claim credit under their own attribution rules. Summed naively, that lead gets counted twice in a blended total. The fix isn't picking one platform's claim over the other, it's deciding, explicitly, how cross-channel credit gets handled in the blended model, and documenting that decision the same way a single platform's conversion window gets documented.
Mismatched date grains. One platform might report by impression date, another by conversion date, a point covered in more depth in the numbers-mismatch piece linked above. Blending five sources multiplies this problem by five unless the model's date dimension enforces one consistent definition every fact table maps to.
Currency and unit inconsistencies. An agency running campaigns in multiple currencies, or reporting cost-per-lead in one platform's native currency and another's converted figure, can produce a blended number that's technically summed correctly and still wrong, because the units being summed weren't actually the same thing.
None of these are difficult to fix individually. They're difficult to notice, because a blended total still returns a plausible-looking number even when one of these errors is quietly inflating or deflating it. Picture a hypothetical, illustrative case: a blended ROAS skewed by an uncaught currency mismatch doesn't look broken. It looks like a campaign performing slightly better or worse than expected, and gets treated as a strategy question instead of a data question, until someone eventually traces the number back far enough to find the actual cause.
This is part of why documenting the blending logic matters as much as building it. A written note on the blended measure, which platforms feed it, how cross-channel credit is handled, what currency everything is normalized to, gives a future reviewer (or a client asking a pointed question) something concrete to check, instead of a black-box number nobody but its original builder can explain.
Where This Fits
This is Data Foundation work specifically: building the fact tables, the conformed dimensions, and the certified blended measures once, so every client report and every future AI feature draws from the same reconciled structure instead of five spreadsheets stitched together by hand each month.
Most agencies don't need every platform blended on day one. Starting with whichever two or three sources feed the metrics clients actually see first, usually spend and leads, produces a working blended model faster than trying to reconcile all five sources simultaneously. Once that first blended pair is certified, documented, and actually trusted, adding a third and fourth source is a much smaller lift than building all five at once, because the client and date dimensions the first two sources needed already exist and just need extending.
Book a Reporting Diagnostic to find out which of your platforms are actually ready to blend, and which ones still need their own reconciliation work first.
Next in this series: why a monthly PDF client deck is already out of date the moment it's sent, and what a live, self-serve dashboard actually changes.