

Why Marketing Agencies Need Power BI (and What a Complete Analytics Solution Actually Looks Like)
Picture a hypothetical, illustrative version of a call every agency has had. A client pulls up their own dashboard. Your team pulls up the platform report. The two numbers don't match, and the next ten minutes get spent debating whose number is right instead of what to do about the campaign. Nobody remembers why last month's ROAS changed either, so that debate restarts too.
That scenario isn't really about a missing tool. It's what happens by default when campaign, client, and CRM data live in systems that were never built to agree with each other, and it's the specific problem this piece is about.
Key Takeaways
- Agency reporting breaks down for a structural reason, not a tooling reason: Google Ads, Meta, LinkedIn, TikTok, a CRM, and a client spreadsheet each define spend, leads, and conversions slightly differently, and nothing forces them to reconcile.
- Power BI fixes this because it's built to connect many different data sources into one model, not because it's inherently smarter than a spreadsheet, per Microsoft's own documentation.
- A complete solution is four connected steps, not one Power BI project: know what's actually broken, build a trustworthy data foundation, build reporting around real decisions, then add AI to specific recurring tasks, in that order.
- Skipping straight to a dashboard or an AI pilot without the foundation underneath it just moves the same disagreement into a more polished-looking format, faster.
The Real Cost of Reporting That Doesn't Hold Up
The cost here isn't abstract. Every reconciliation call is time an account manager didn't spend on the campaign itself. Every unexplained number swing is a small hit to a client's confidence in the agency's competence, even when the underlying work was good. And every AI pilot built on data nobody fully trusts is a project that quietly never makes it in front of a client, because showing it means defending numbers that might not hold up to a follow-up question.
None of this shows up as a single dramatic failure. It shows up as a slow tax: reporting cycles that take longer than they should, account managers who've learned to pad every number with a caveat, and a growing gap between what the agency's tools can technically do and what anyone actually trusts enough to say out loud on a client call.
The tax compounds with growth, which is the part that catches agencies off guard. A process that just barely holds together for five client accounts, one person manually reconciling a few spreadsheets each month, doesn't scale linearly to fifteen. It breaks somewhere in between, usually quietly: a metric definition drifts on one account without anyone deciding it should, a new hire builds a report using a different formula than the one everyone else uses, and by the time anyone notices, three different "true ROAS" numbers exist across the agency's own internal materials, not just in the gap between the agency and the client.
Gartner's own May 2026 research on semantic layers frames the underlying mechanism directly: a lack of consistent shared definitions is a primary driver of unreliable AI and analytics outcomes, not a secondary concern to address later (Gartner, retrieved 2026-09-18). Agencies feel this earlier and more visibly than most businesses, because the numbers go in front of a paying client on a recurring schedule, not just an internal audience once a quarter.
Why This Isn't Really a Power BI Problem
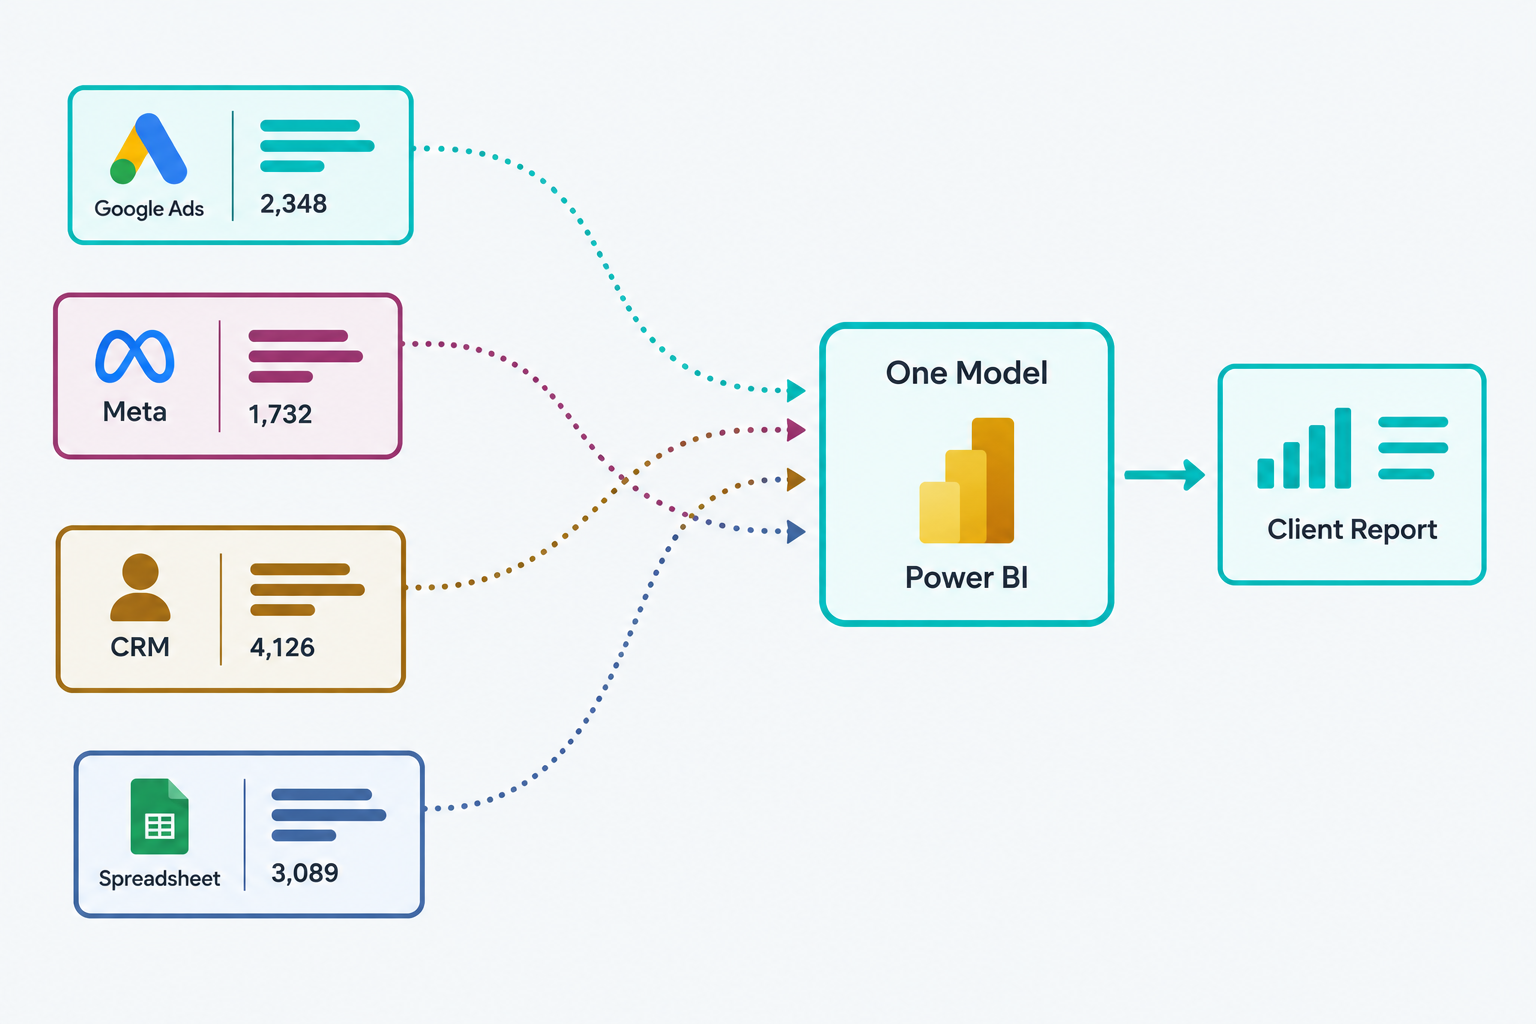
Power BI is built specifically to solve the data-scattering half of this, it's designed to connect to a wide range of data sources, ad platforms, CRMs, spreadsheets, and databases among them, and combine them into one model instead of leaving each one as its own isolated report (Microsoft Learn). But installing Power BI and connecting a few sources to it doesn't automatically produce agreement. It just moves the same disagreement into a more polished-looking tool, unless the work underneath that connection is done deliberately.
That's the part most "move to Power BI" conversations skip. Migrating from a spreadsheet to a dashboard tool is a format change. It doesn't touch the actual question of whether "leads" means the same thing in the CRM export as it does in the Meta Ads report, and if that question was never answered, the new dashboard just presents the old disagreement with better formatting.
A complete solution is four connected services, in a specific order, because skipping ahead is where most agency data and AI projects go wrong:
Know what's actually broken first. Before touching a dashboard, map which numbers actually disagree, why, and which ones matter enough to fix first. Not every metric needs this treatment, usually it's a short list of high-visibility numbers, not the entire reporting stack.
Trust the data foundation. Connect ad platforms, the CRM, and billing systems into one validated model, with one definition of spend, leads, and ROAS that every report pulls from instead of recalculating.
Build reporting around real decisions. Power BI reports and semantic models constructed around what a campaign or funnel actually needs someone to decide, not another dashboard nobody opens, built to hold up when a client questions the numbers.
Apply AI to specific, recurring tasks. Grounded performance summaries, account-manager questions answered against approved data, recurring reporting steps automated with the right controls, evaluated against one test: does it measurably improve a defined task. If it doesn't, that's a reason to skip it, not force it in.
What a Complete Analytics Solution Actually Includes
In practice, that four-step sequence shows up as a handful of very specific, recognizable problems. This series is going deeper into each one:
Client numbers that never match platform numbers. The reconciliation problem at the root of most agency reporting friction, and usually the first symptom anyone notices, long before anyone connects it to a foundation problem rather than a one-off reporting error.
Outgrowing spreadsheets. Specifically what breaks first as an agency adds more client accounts to a process that was only ever stress-tested informally, formula drift, version conflicts between copies, or the sheer time cost of manual reconciliation, and why that failure point tends to arrive earlier than most agencies expect.
Five platforms, one model. Unifying Google Ads, Meta, LinkedIn, TikTok, and a CRM into consistent, blended metrics like true ROAS and true cost per lead, calculated once correctly instead of estimated by hand in a spreadsheet every reporting cycle. Power BI's composite models are built specifically for this kind of blending, combining multiple data sources into one model rather than forcing every platform into a single rigid connection type (Microsoft Learn).
Static PDF decks that are out of date the moment they're sent. What a live, self-serve client dashboard actually changes, both for how many follow-up emails an account manager fields and for how a client experiences the agency's reporting between scheduled check-ins.
Catching a problem before the client does. Monitoring and alerts on the metrics that actually matter, so a CPL spike or a conversion drop surfaces the moment it happens instead of at the next scheduled report, when the client's often already noticed it themselves.
Where AI actually helps, and where it's just a confident-sounding way to be wrong faster. Applied to agency reporting specifically: drafting client-ready performance narratives, answering account-manager questions against approved data, and automating recurring reporting steps, each evaluated against whether it measurably improves a defined task.
Account profitability, the report most agencies never build. Client-facing reports show campaign performance. They almost never show whether an account is actually worth the hours it takes to manage once retainer value and team time are factored in, which is a different, internally-facing question entirely.
In-house hire versus a fractional partner. The real trade-off agencies weigh once they decide this is worth fixing properly: ramp-up time, headcount commitment, and whether one person can own data engineering, reporting, and applied AI end to end instead of splitting responsibility across vendors.
Each of those gets its own dedicated piece. This one is the map, worth bookmarking if only one of those problems sounds familiar right now, because the other seven tend to show up eventually too, usually in roughly the order they're listed here.
Who Actually Runs Into This
Not every agency or marketing team hits this problem the same way, but the pattern shows up across a few recognizable shapes. Performance marketing agencies see it as campaign, spend, and conversion data spread across ad platforms and a CRM that never quite agrees with the client deck. Full-service and creative agencies see it as multiple client accounts, each with its own reporting format, stitched together by hand every month. In-house marketing and growth teams see it as marketing, sales, and revenue data living in separate systems, with reporting that answers what happened but rarely what to do next. Multi-location and franchise marketing operations see it as the same campaign structure run across many locations, with performance data that's hard to compare apples to apples. And marketing ops teams at B2B SaaS companies see it as pipeline and attribution data split across ad platforms, CRM, and product analytics, with no single source everyone actually trusts.
Different entry points, same underlying shape: data that's technically available everywhere and trustworthy nowhere in particular. See what this looks like applied specifically to marketing agencies for a closer look at each of these entry points.
Where This Fits
None of this is sold as separate, disconnected services. A trustworthy data foundation is what a reliable report gets built on. A reliable report is what makes an AI-generated summary worth reading. Each layer exists because the one before it made it possible, which is also why starting at the wrong layer (an AI pilot with no foundation underneath it, a dashboard built on unreconciled data) tends to produce something that looks finished but doesn't hold up the first time a client pushes back on a number.
That's also why this isn't framed as a rip-and-replace pitch. Most agencies already have a real Microsoft stack in place, Power BI, some SQL, a CRM that's not going anywhere, and the goal isn't convincing you to abandon it. It's finding out which of the four layers is actually holding the rest back, and fixing that one first, in scoped stages, rather than proposing a platform overhaul nobody asked for.
If any part of this sounds like your agency's current reporting, the fastest way to find out where you actually stand is a scoped look at what's already working and what isn't. That diagnostic produces a defined deliverable regardless of what happens next, a clear, written read on where your current reporting is reliable, where it's fragile, and what would break first as you add more accounts. Book a Reporting Diagnostic and find out what your data is actually telling you.